JavaScript Libraries for Creating Circular Charts
These libraries don’t use images to represent images; instead they use HTML 5 canvas to create circular form of graph.
1. Cake Chart
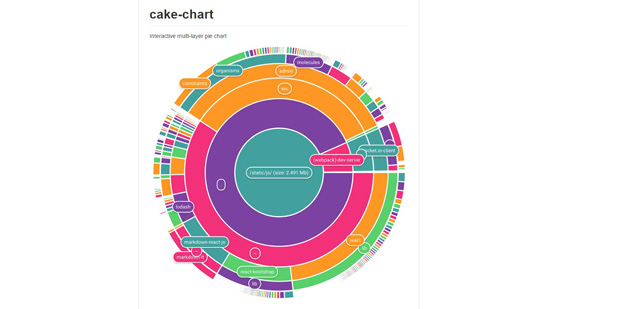
Cake Chart is a javascript library to create interactive multi-layer pie charts. CakeChart is a quite dumb component that renders provided tree, but doesn’t navigate through it, so you have to implement that part yourself. Which is not hard though.
2. Morris.js
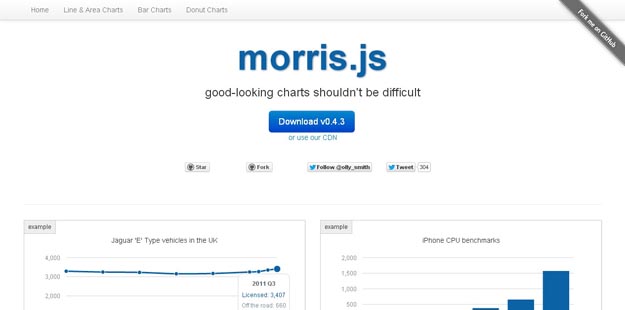
Morris.js is the library that powers the time-series graphs. It’s a very simple API for drawing line, bar, area and donut charts.
3. gRaphael
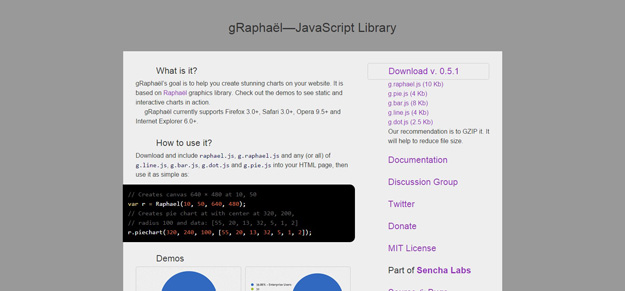
gRaphaël’s goal is to help you create stunning charts on your website. It is based on Raphaël graphics library. gRaphaël currently supports Firefox 3.0+, Safari 3.0+, Opera 9.5+ and Internet Explorer 6.0+.
4. jqPlot
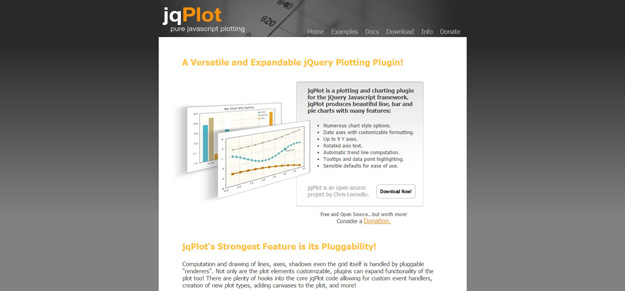
jqPlot is a plotting and charting plugin for the jQuery Javascript framework. jqPlot produces beautiful line, bar and pie charts with many features such as numerous chart style options, rotate axis text, tooltip and data point highlighting, up to 9 Y axes and many more.
5. ECharts
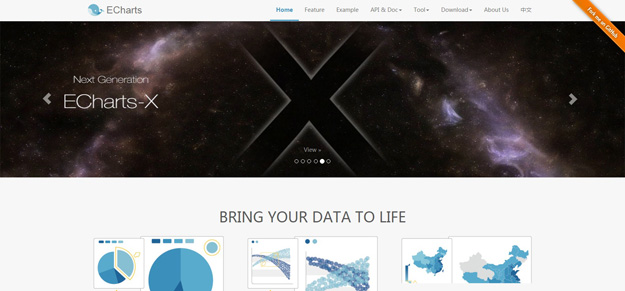
ECharts is a comprehensive charting library offering a painless way of adding interactive charts to your products. ECharts currently supports line, column, scatter, pie, radar, candlestick, chord, gauge, funnel, map and force-directed chart types, many of these can be combined in one chart.
6. Circle
Circle is a Small JavaScript library that generates circular graphs.
7. JSGraphics.js
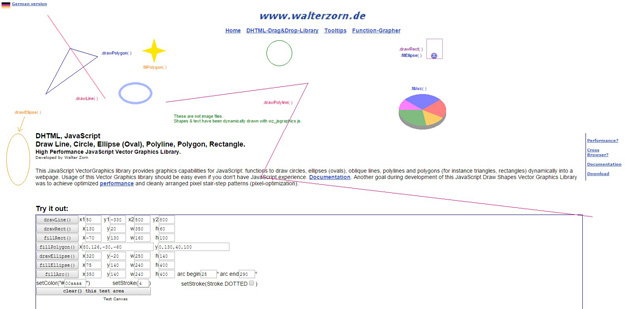
This JavaScript VectorGraphics library provides graphics capabilities for JavaScript: functions to draw circles, ellipses (ovals), oblique lines, polylines and polygons (for instance triangles, rectangles) dynamically into a webpage. Usage of this Vector Graphics library should be easy even if you don’t have JavaScript experience.
8. CircleDonutChart
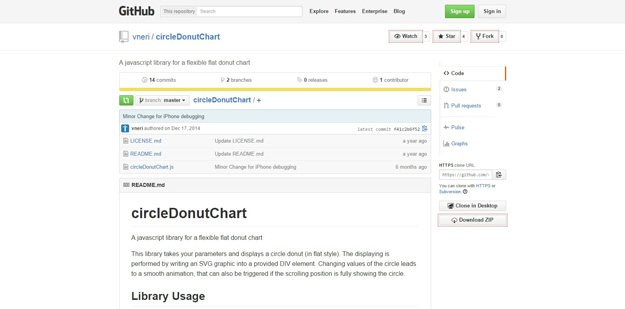
This library takes your parameters and displays a circle donut (in flat style). The displaying is performed by writing an SVG graphic into a provided DIV element. Changing values of the circle leads to a smooth animation that can also be triggered if the scrolling position is fully showing the circle.
9. Circles
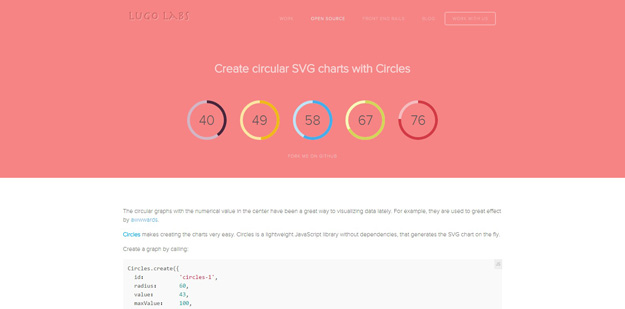
Circles is a lightweight JavaScript library without dependencies, that generates the SVG chart on the fly.
10. jQuery Kontrol
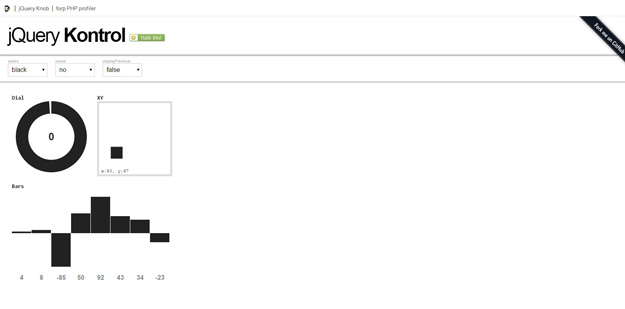
jQuery Kontrol is a experimental JavaScript jQuery library of UI controls ; dial (was jQuery Knob), XY pad, bars. It is canvas based so no png or jpg sprites. It also have touch, mousewheel, keyboard events implementation.
11. Chart.js
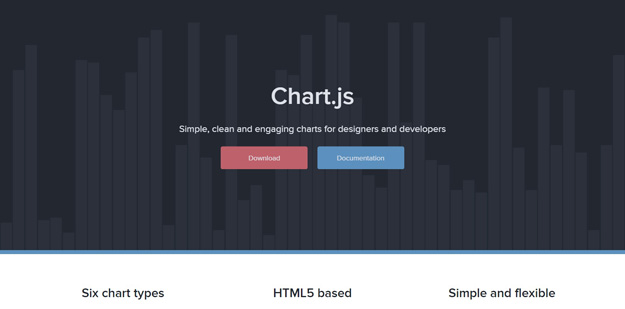
Chart.js is an easy, object oriented client side graphs for designers and developers. You can visualise your data in 6 different ways. Each of them animated, fully customizable and look great, even on retina displays. Chart.js uses the HTML5 canvas element. It supports all modern browsers, and polyfills provide support for IE7/8.
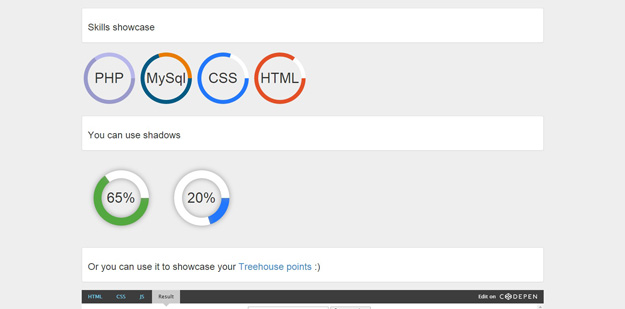
12. Circliful
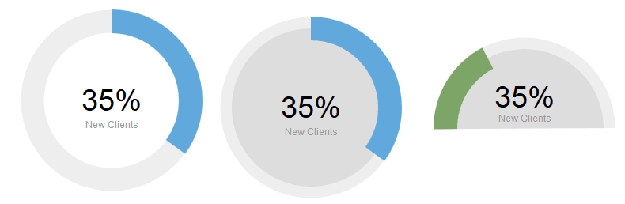
Circliful is a jQuery plugin for showing circle statistics; It is based on HTML 5 and jQuery so no images are used.